Situation in Spain 🇪🇸 with COVID-19
Data Source and Descriptions 🚨
The data is taken from the tidycovid19(Gassen 2020a) package 📦 created by Joachim Gassen. The tidycovid19 package was created to provide transparent access to various data sources. Then, used download_merged_data to merge the dataset. This merged dataset contains data of coronavirus confirmed, recovered, death original collected from Johns Hopkins University(University 2020). Some other variables contain the frequency places are visited from Google Community Mobility Reports(Google 2020). The second set of data comes from Bing(Bing 2020), which contains all the regions location and cases in Spain. The raw data was stored in two CSV files separately. The data collection date for this blog until 13 Sep 2020. The following map and plots present these variables in the data set and also contain descriptions.
How lockdown restriction impact citizen daily activity? 👣
Countries around the world are in uncharted territory. The emergence and spread of COVID-19 have touched every facet of society. The Spain nationwide lockdown began at 14 Mar 2020, as a result, daily life comes to a halt, such as public gathering party are cancelled, employees were sent back to home. All sizes of business are facing many uncertainties about their prospects.
The following Figure 3 and Figure 4 presents the changes in different activities regarding the lockdown restrictions🔒. Up to now, stage four restrictions happened twice since the beginning of lockdown at March 14. Stage four was an advanced phase, in which the restriction was limited. More than 23,000 people have died in Spain after contracting coronavirus, making the country one of the worst affected in the world by the illness. At this period, thousands of employee were forced to work at home during nearly three-month coronavirus lockdown. Therefore, people visited workplaces has dropped about 50% compared with before. After the fourth stage lockdown restriction ended, employees allowed to work in the physical workplace and frequency that people visit workplaces increased, but still lower than the average rate. Remote working caused by coronavirus has made many people aware of the convenience. Besides, Spain government are protecting the rights of remote workers. Such as distance working must be a voluntary choice ,or employees have the right to apply compensation for any direct or indirect costs related to remote work ELPAIS(ELPAIS 2020).

Figure 3: The frequency that people visit workplaces and residential relative to the baseline period Jan 3 - Feb 6, 2020.
Within the lockdown period, parks closed. Most of them transfer the outdoor sports to exercise at home. In Figure 4, people rarely visit parks during the lockdown period. At the end of April, it has seen a steadily declining number of cases per day, leading to the country’s plan to broaden lockdown restrictions. Spain has released an exit strategy from the lockdown restriction in a bid to return the normality, while keeping COVID-19 under control euronews(euronews 2020). With the gradual relaxation of the lockdown restriction, retail and recreation industry allowed to reopen to the public, such as sidewalk café reopened and Spaniards can exercise outdoors CNN(Goodman 2020). As a consequence, the frequency that people visit parks increase over than 50%, which is higher than any other activities.
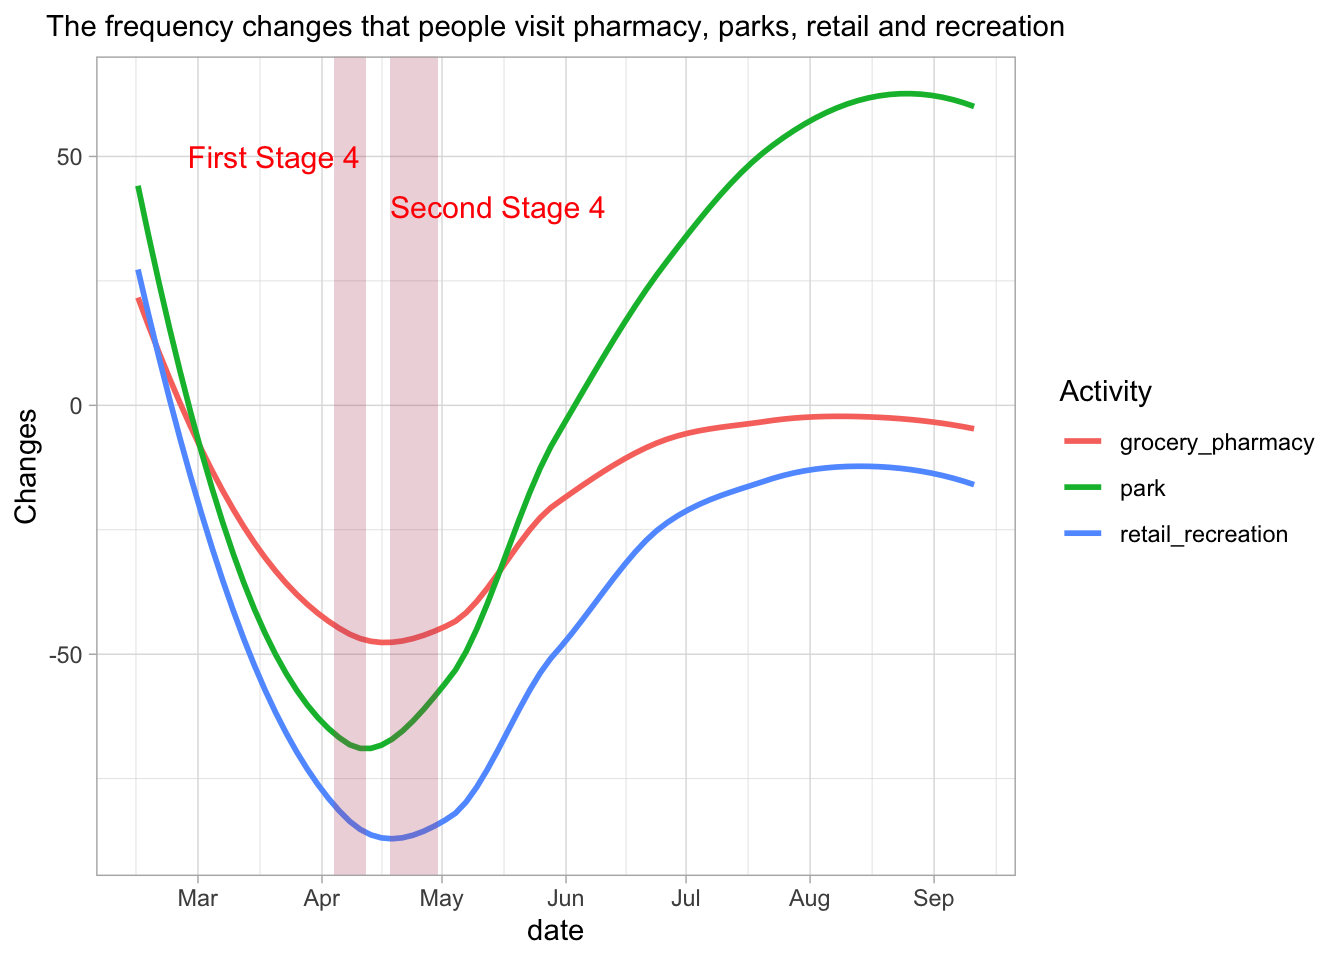
Figure 4: The frequency changes that people visit pharmacy, parks, retail and recreation relative to the baseline period Jan 3 - Feb 6, 2020
Overall, as the pandemic is under control, people’s travel frequency has increased, especially for outdoor activities. For now, Spain has decreased to the first level of lockdown, daily life gradually returns to normal. However, face masks are now obligatory at ALL times and keep two meters social distance. Some regions such as Aragon Madrid and Cataluña are currently experiencing outbreaks that have brought back lockdown in some towns and areas. The government is also making regulations based on the current situation.
Acknowledgements
The packages used for producing this post are:
tidyverse (Wickham et al. 2019), knitr (Xie 2014), kableExtra (Zhu 2019), dplyr (Wickham et al. 2020), tidycovid19(Gassen 2020b), zoo(Zeileis and Grothendieck 2005), ggplot(Wickham 2016),scales(Wickham and Seidel 2020), highcharter(Kunst 2020), leaflet(Cheng, Karambelkar, and Xie 2019), lubridate(Grolemund and Wickham 2011).
The raw data comes from two github repositories: tidycovid19(Gassen 2020a) and Bing(Bing 2020).
References
Bing. 2020. “Bing Covid-19 Data.” GitHub Repository. https://github.com/microsoft/Bing-COVID-19-Data; GitHub.
Cheng, Joe, Bhaskar Karambelkar, and Yihui Xie. 2019. Leaflet: Create Interactive Web Maps with the Javascript ’Leaflet’ Library. https://CRAN.R-project.org/package=leaflet.
ELPAIS. 2020. “Flexible Schedules and Covered Expenses: Spain Drafts Bill Protecting the Rights of Remote Workers.” https://english.elpais.com/economy_and_business/2020-06-26/flexible-schedules-and-covered-expenses-spain-drafts-bill-protecting-the-rights-of-remote-workers.html.
ELTAIS. 2020. “Spain’s Coronavirus Crisis: Why the Numbers Are Failing to Show the Full Picture.” https://english.elpais.com/society/2020-04-05/spains-coronavirus-crisis-why-the-numbers-are-failing-to-show-the-full-picture.html.
euronews. 2020. “Coronavirus: Spain Reveals Four-Stage Plan to de-Escalate from Covid-19 Lockdown.” https://www.euronews.com/2020/04/29/coronavirus-spain-reveals-four-stage-plan-to-de-escalate-from-covid-19-lockdown.
Gassen, Joachim. 2020a. “Download, Tidy and Visualize Covid-19 Related Data.” GitHub Repository. https://github.com/joachim-gassen/tidycovid19; GitHub.
———. 2020b. Tidycovid19: Download, Tidy and Visualize Covid-19 Related Data.
Goodman, Al. 2020. “After 7 Weeks of Lockdown, Spaniards Can Finally Exercise Outdoors – as Death Toll Passes 25,000.” https://www.cnn.com/2020/05/02/europe/spain-lockdown-coronavirus-exercise-intl/index.html.
Google. 2020. “See How Your Community Is Moving Around Differently Due to Covid-19.” Google Community. https://www.google.com/covid19/mobility/; Google.
Grolemund, Garrett, and Hadley Wickham. 2011. “Dates and Times Made Easy with lubridate.” Journal of Statistical Software 40 (3): 1–25. http://www.jstatsoft.org/v40/i03/.
Guardian. 2020. “How Did Spain Get Its Coronavirus Response so Wrong?” https://www.theguardian.com/world/2020/mar/26/spain-coronavirus-response-analysisl.
Kunst, Joshua. 2020. Highcharter: A Wrapper for the ’Highcharts’ Library. https://CRAN.R-project.org/package=highcharter.
Organization, World Health. 2020. “Spain Covid-19 Dashboard.” https://covid19.who.int/region/euro/country/es.
University, Johns Hopkins. 2020. “COVID-19 Data Repository by the Center for Systems Science and Engineering (Csse) at Johns Hopkins University.” GitHub Repository. https://github.com/CSSEGISandData/COVID-19; GitHub.
Wickham, Hadley. 2016. Ggplot2: Elegant Graphics for Data Analysis. Springer-Verlag New York. https://ggplot2.tidyverse.org.
Wickham, Hadley, Mara Averick, Jennifer Bryan, Winston Chang, Lucy D’Agostino McGowan, Romain François, Garrett Grolemund, et al. 2019. “Welcome to the tidyverse.” Journal of Open Source Software 4 (43): 1686. https://doi.org/10.21105/joss.01686.
Wickham, Hadley, Romain François, Lionel Henry, and Kirill Müller. 2020. Dplyr: A Grammar of Data Manipulation. https://CRAN.R-project.org/package=dplyr.
Wickham, Hadley, and Dana Seidel. 2020. Scales: Scale Functions for Visualization. https://CRAN.R-project.org/package=scales.
Xie, Yihui. 2014. “Knitr: A Comprehensive Tool for Reproducible Research in R.” In Implementing Reproducible Computational Research, edited by Victoria Stodden, Friedrich Leisch, and Roger D. Peng. Chapman; Hall/CRC. http://www.crcpress.com/product/isbn/9781466561595.
Xinhua. 2020. “China to Continue Helping Spain Fight Covid-19 Epidemic: FM ?” http://www.xinhuanet.com/english/2020-05/13/c_139051653.htm.
Zeileis, Achim, and Gabor Grothendieck. 2005. “Zoo: S3 Infrastructure for Regular and Irregular Time Series.” Journal of Statistical Software 14 (6): 1–27. https://doi.org/10.18637/jss.v014.i06.
Zhu, Hao. 2019. KableExtra: Construct Complex Table with ’Kable’ and Pipe Syntax. https://CRAN.R-project.org/package=kableExtra.