Canada COVID19 Post 🇨🇦
About Canada 🇨🇦
Coronavirus disease 2019 (COVID‑19) is an infectious disease caused by severe acute respiratory syndrome coronavirus 2 (SARS-CoV-2). The situation around the world still serious, and Canada is one of them. The virus was confirmed to spread Canada on January 25, 2020, after a citizen who had traveled ✈️ from Wuhan, Hubei to Toronto, tested positive. With government policies, such as restricting people’s travel and maintaining social distancing, the cases have declined significantly.
Data Source and Description 🎯
The dataset used in this post is from Isha Berry personal GitHub(Berry I 2020) and the data source is Canadian Medical Association Journal (CMAJ).
The COVID-19 data regarding Canada was collected by COVID-19 Canada Open Data Working Group on confirmed and positive cases. Each line in the dataset represents a unique cases. The original dataset also include information such as age, sex, history travel. The cases, death, recovered dataset were created since the first relevant event occurred. The raw data was stored in seven CSV files separately. The data collection date for this blog until August 27, 2020. The following tables and plots present these variables in the data set and also contain descriptions.
Each Province COVID-19 Details 🔍
This interactive datatable concentrate on number of cumulative confirmed cases, daily new cases, cumulative deaths, daily new deaths and the number of recovered in each province and the whole Canada.
Numercial Summary Statistics 📄
Table 1 shows that numerical summary statistics of four variables: daily new cases, cumulative cases, daily new deaths and cumulative deaths. In the Max column, the max of daily new cases and daily new deaths represent the maximum value in a day since the COVID-19 spread to Canada, while the max of cumulative cases and cumulative deaths shows the latest results. At the end of the table, cases and deaths in Canada were declined significantly 📉.
Stories behind the Data:
Although cases and deaths in Canada was declined obviously, the authenticity of the data is not accurate. Indigenous Canadians as the indigenous people within the boundaries of the Canada. Indigenous people in Canada take 4.9% of the whole national population. Regarding the CBC news, Indigenous Services Canada releases cumulative number of positive cases, but no data on deaths, recoveries regarding the news from CBC(CBC 2020). As a result, the histogram at the end of the Table 1 does not present a full picture of the indigenous communities. Besides, indigenous communities received inequitable measures from federal government. As of June 25, Canada’s specific measures to limit the spread of COVID-19 in First Nations communities in Canada represent less than one per cent of the federal government’s funding to mitigate the impact of COVID-19 The Conversation(Conversation 2020).
| Variable | Mean | Min | Q1 | Q2 | Q3 | Max | Hist |
|---|---|---|---|---|---|---|---|
| cases | 773.80723 | 84 | 343.75 | 617.5 | 1196.75 | 2560 | ▇▃▃▂▁ |
| cumulative_cases | 79281.09036 | 341 | 46659.75 | 96145.5 | 111333.00 | 128709 | ▃▂▂▅▇ |
| deaths | 52.82081 | 0 | 6.00 | 22.0 | 96.00 | 229 | ▇▂▂▂▁ |
| cumulative_deaths | 5661.34104 | 1 | 1757.00 | 7456.0 | 8848.00 | 9138 | ▃▁▁▂▇ |
Explore the Relationship between Testing and Cases 📈
Only for personal interest 🤨, I want to explore the relationship between cases and testing. Since the first cases arrived in Canada in January 25, 2020, the government started to test from March 8, 2020. Therefore, I combine the testing data and cases data together and select all data from March 8 until now. In my personal prediction, with the development of testing, there will be more confirmed cases. In other words, these two variables have the positive relationship. However, from this combination graph, it could not find the relationship between cases and testing in Fig1. In addition, R-squared is 0.188 which is close to 0. Also represents if the cases and testing is linear regression, all the real data is far away from the line. The results regarding R-squared is show in Table 2. The reason they are not related may be that Canada has almost controlled the worsening of the COVID-19 in this period.
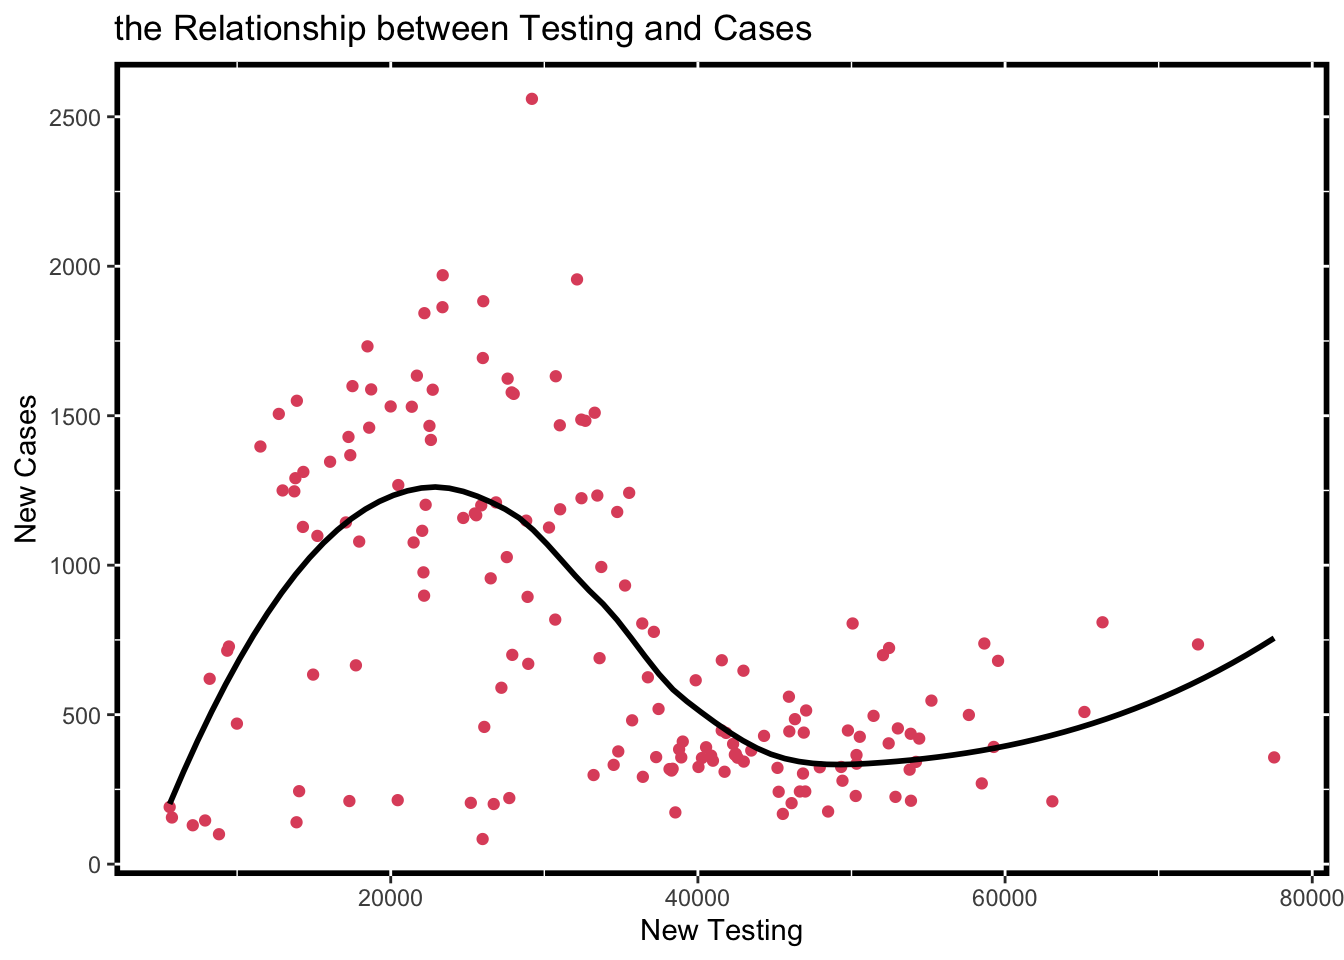
Figure 1: Relationship between testing and cases
| r.squared | adj.r.squared | statistic | p.value | AIC | BIC |
|---|---|---|---|---|---|
| 0.1887101 | 0.1837632 | 38.14722 | 0 | 2520.831 | 2530.167 |
Acknowledgements
The packages used for producing this post are:
tidyverse (Wickham et al. 2019), broom (Robinson, Hayes, and Couch 2020), skimr (Waring et al. 2020), DT (Xie, Cheng, and Tan 2020), knitr (Xie 2014), kableExtra (Zhu 2019), dplyr (Wickham et al. 2020), lubridate(Grolemund and Wickham 2011).
Two news comes from: CBC(CBC 2020), The Conversation(Conversation 2020)
The raw data comes from Canada(Berry I 2020)
References
Berry I, Tuite A, Soucy J-PR. 2020. “Covid19Canada.” GitHub Repository. https://github.com/ishaberry/Covid19Canada; GitHub.
CBC. 2020. “Data Gaps Exist on Covid-19 Cases in Indigenous Communities, Says Research Fellow.” https://www.cbc.ca/news/indigenous/coronavirus-indigenous-data-gap-1.5556676.
Conversation, The. 2020. “Indigenous Communities at Increased Risk During the Coronavirus Pandemic.” https://theconversation.com/indigenous-communities-at-increased-risk-during-the-coronavirus-pandemic-142027.
Grolemund, Garrett, and Hadley Wickham. 2011. “Dates and Times Made Easy with lubridate.” Journal of Statistical Software 40 (3): 1–25. http://www.jstatsoft.org/v40/i03/.
Robinson, David, Alex Hayes, and Simon Couch. 2020. Broom: Convert Statistical Objects into Tidy Tibbles. https://CRAN.R-project.org/package=broom.
Waring, Elin, Michael Quinn, Amelia McNamara, Eduardo Arino de la Rubia, Hao Zhu, and Shannon Ellis. 2020. Skimr: Compact and Flexible Summaries of Data. https://CRAN.R-project.org/package=skimr.
Wickham, Hadley, Mara Averick, Jennifer Bryan, Winston Chang, Lucy D’Agostino McGowan, Romain François, Garrett Grolemund, et al. 2019. “Welcome to the tidyverse.” Journal of Open Source Software 4 (43): 1686. https://doi.org/10.21105/joss.01686.
Wickham, Hadley, Romain François, Lionel Henry, and Kirill Müller. 2020. Dplyr: A Grammar of Data Manipulation. https://CRAN.R-project.org/package=dplyr.
Xie, Yihui. 2014. “Knitr: A Comprehensive Tool for Reproducible Research in R.” In Implementing Reproducible Computational Research, edited by Victoria Stodden, Friedrich Leisch, and Roger D. Peng. Chapman; Hall/CRC. http://www.crcpress.com/product/isbn/9781466561595.
Xie, Yihui, Joe Cheng, and Xianying Tan. 2020. DT: A Wrapper of the Javascript Library ’Datatables’. https://CRAN.R-project.org/package=DT.
Zhu, Hao. 2019. KableExtra: Construct Complex Table with ’Kable’ and Pipe Syntax. https://CRAN.R-project.org/package=kableExtra.